
Transforming data into information
SAP Lumira version 2.x is SAP’s response to the need to visualize data. The operation of every company is based primarily on making decisions by managers. Daily business, short-term or long-term decisions should be based on the current situation in the company. To enable this, every company that wants to develop regardless of its industry, uses the process of data analysis, i.e. transforming raw data into valuable information. Therefore, Lumira 2.x is addressed to all persons in the company responsible for making key business decisions.
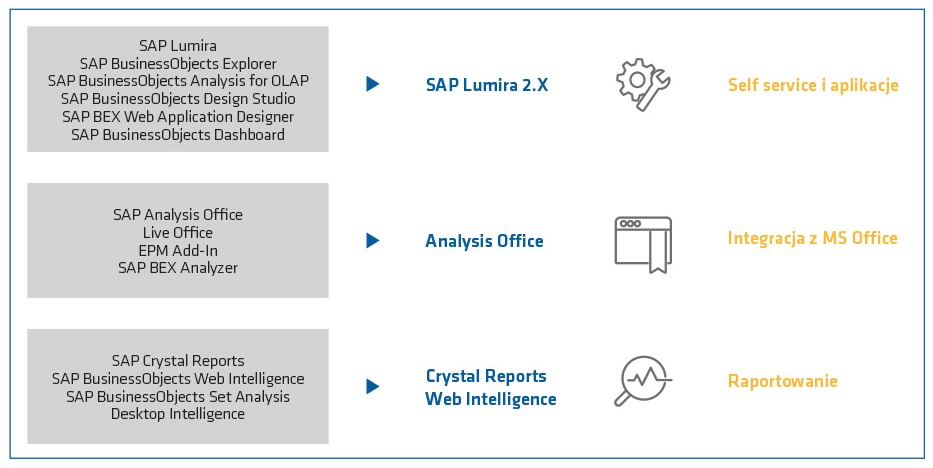
Fig. Consolidation of SAP analytical tools portfolio.
Instead of scrolling through thousands of rows and hundreds of columns in Excel, you can get an insight into the company’s situation with a single dashboard and a few clicks. This product can be fed with data from the following sources: flat files, an ERP system, a data warehouse, a world of objects or a HANA database. You can refresh data in the management dashboard in real time or present it offline.
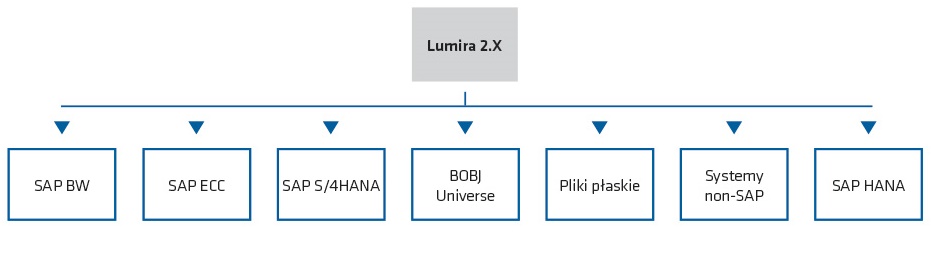
Fig. Possible types of data sources supported by Lumira 2.x.
The dashboard prepared in SAP Lumira can be used primarily for monitoring Key Performance Indicators (KPIs), risk assessment, determining dependencies between data, highlight hidden facts and identify upcoming business opportunities. SAP Lumira 2.x gives you the opportunity to use two ways to change raw data into a full picture of the situation: SAP Lumira Discovery and SAP Lumira Designer.
SAP Lumira Discovery
With the Discovery variant, SAP primarily took care of the aspect of self-service of analysts, controlling department employees and managers. This means that the user can create a dashboard on their own without the help of the IT department to answer everyday business questions. SAP Lumira Discovery is recommended for business users from all departments of the company who want to create simple management dashboards on their own. It is an easy to use tool equipped with a drag-and-drop interface, without any need to write even one code line. It enables you to build a dashboard/report using the available types of data sources with the possibility of combining them.
SAP Lumira Designer
At the same time, the IT department receives a tool to create interactive, device-tailored corporate dashboards used for standardized reporting in the organization. SAP Lumira Designer is used by advanced users, data analysts, IT staff to create complex dashboards, planning applications or analytical applications using SAP system authorizations and scheduling capabilities.
By using extensions for developers (SDK), cascading style sheets (CSS) and the ability to reuse element templates, SAP has introduced full flexibility and shortened the time needed to prepare dashboards.
Additionally, the dashboard created in the Discovery tool can be imported into the Designer tool to extend its functionality. Managers or analysts can also exchange comments on the company’s performance, using the comments component embedded in the management dashboard (the ability to enter comments for a specific dashboard user only or globally for all of them).
It is worth noting that dashboards created both in Discovery and Designer enable you to set the responsiveness of the application, which enables you to use the dashboards also on mobile devices without any problems.
Data visualizations created in this way can be easily published on the SAP BusinessObjects BI platform, saved as a “*.LUMX” file on a local workstation or exported in the “*.PDF” format.
Benefits
In addition to the aforementioned multitude of data sources (connectors), the benefits of implementing Lumira 2.x tools include first of all empowering managers or analysts to visualize data and create simple management dashboards using the Discovery variant.
Another benefit is the involvement of the IT department in cooperation with business users in order to create advanced analytical applications, planning applications or management dashboards using the Designer variant. The IT team also has the ability to extend the dashboard created using Discovery by importing it and adding components of the Designer variant (e.g. SAP Fiori).
It should also be mentioned that SAP took care of the customers who have dashboards created in Design Studio and Lumira 1.x tools, enabling their conversion to the format corresponding to the new Lumira 2.x tool.
Dashboards are available on demand, without the need for manual processing of input data. The consistency with the SAP system architecture minimizes the risk of human error during manual data preparation, e.g. in MS Excel.
The business added value of implementing Lumira 2.x tools is primarily generated by the time saved by analysts or managers. Often, the decision-makers are dependent on IT departments to obtain information from data. The implementation of both variants of Lumira 2.x will enable them to easily access information to be used as a basis for making key decisions for the company. The time saved can be spent on analyzing potential decisions, which will significantly improve the operation of the company.
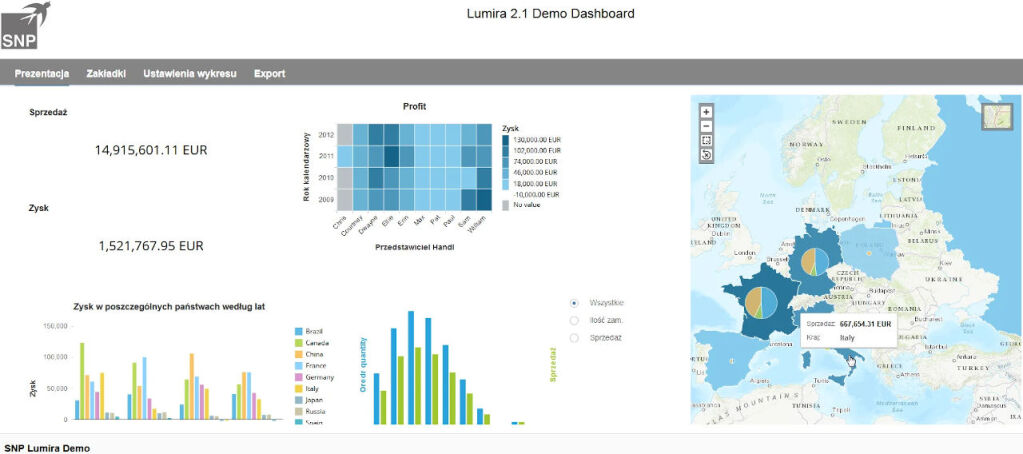
Fig. The management dashboard created with Lumira Designer presenting sales data.
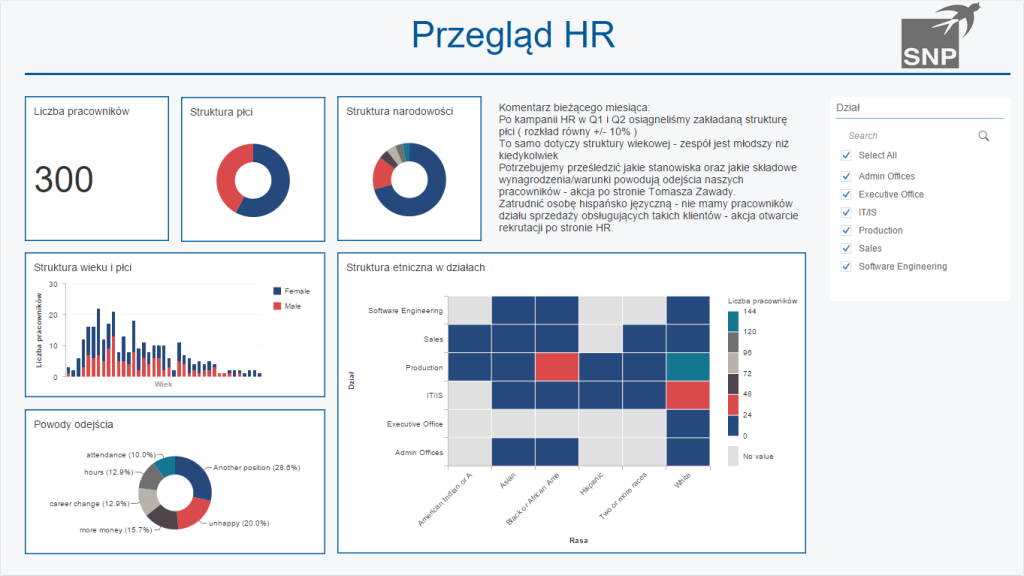
Fig. The dashboard created with Lumira Discovery presenting HR data.