
Graylog is a centralized log management solution built on open-source standards. Developed since 2009, the tool is used to capture, store, and analyze logs in real time. It is used to collect and analyze logs from various sources: operating systems, application servers, and hardware and software firewalls. It can be used to monitor websites, web applications, and many other areas of IT infrastructure.
What sets Graylog apart from a central Syslog server is its use of an Elasticsearch database to store and index documents. This database allows you to search through millions of log records in less than a second. This is an impressive result compared to a standard log search using the Linux `grep` command or pressing Ctrl+F in Notepad.
Log Identification
When Graylog receives a message, it breaks it down into smaller fields. Below is an example of how logs from an Nginx server are broken down.
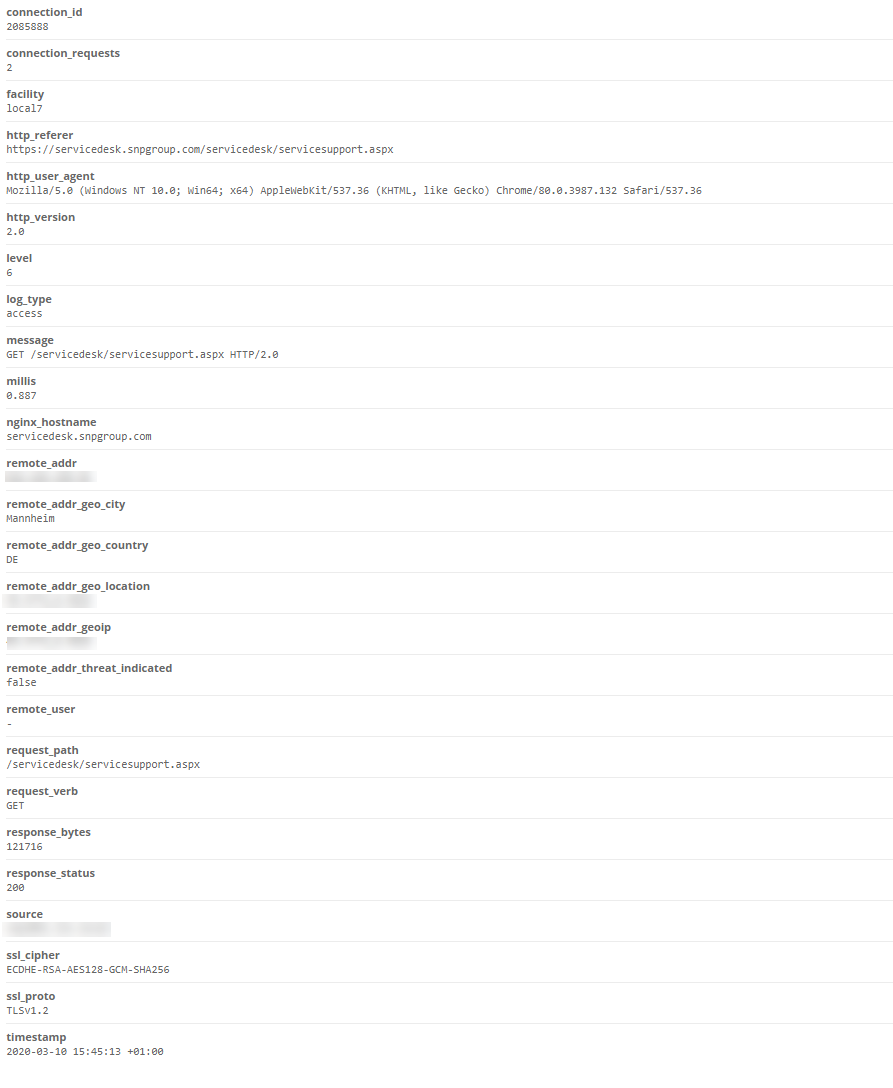
Example breakdown of logs from an Nginx server
Thanks to this filtering, you can easily find all logs generated by a single IP address that end with a 200 status code, without having to write complex regular expressions.
Graylog is integrated with services such as:
- AlienVault Open Threat Exchange (OTX),
- Spamhaus DROP/EDROP lists,
- ch Ransomware Tracker blocklists.
This integration allows us to evaluate the reputation of every IP address and domain and add the relevant information to the log if the reputation of a given IP address or domain is low. This way, we can obtain information about incoming traffic from less reliable addresses.
We can also integrate Graylog with the GeoIP2 database and add geographic coordinates to every IP address that appears in our logs, as well as retrieve data from the WHOIS database and add that information to each IP address. This type of identification can be useful not only for IT infrastructure administration and monitoring. In many companies, this kind of log data is invaluable to marketing, sales, and security departments.
However, simply storing logs in a central repository, without putting them to practical use on a daily basis, is of no value to the company. A good log analysis tool must provide mechanisms that allow for easy access to statistics and trends, as well as alerts for emerging anomalies.
Useful dashboards
The first step for an administrator who wants to take full advantage of log data should be to set up a dashboard in Graylog that provides a clear presentation of information and advanced statistics. A well-designed visualization of the data collected in the logs will allow us to quickly and easily assess what is happening with our systems.
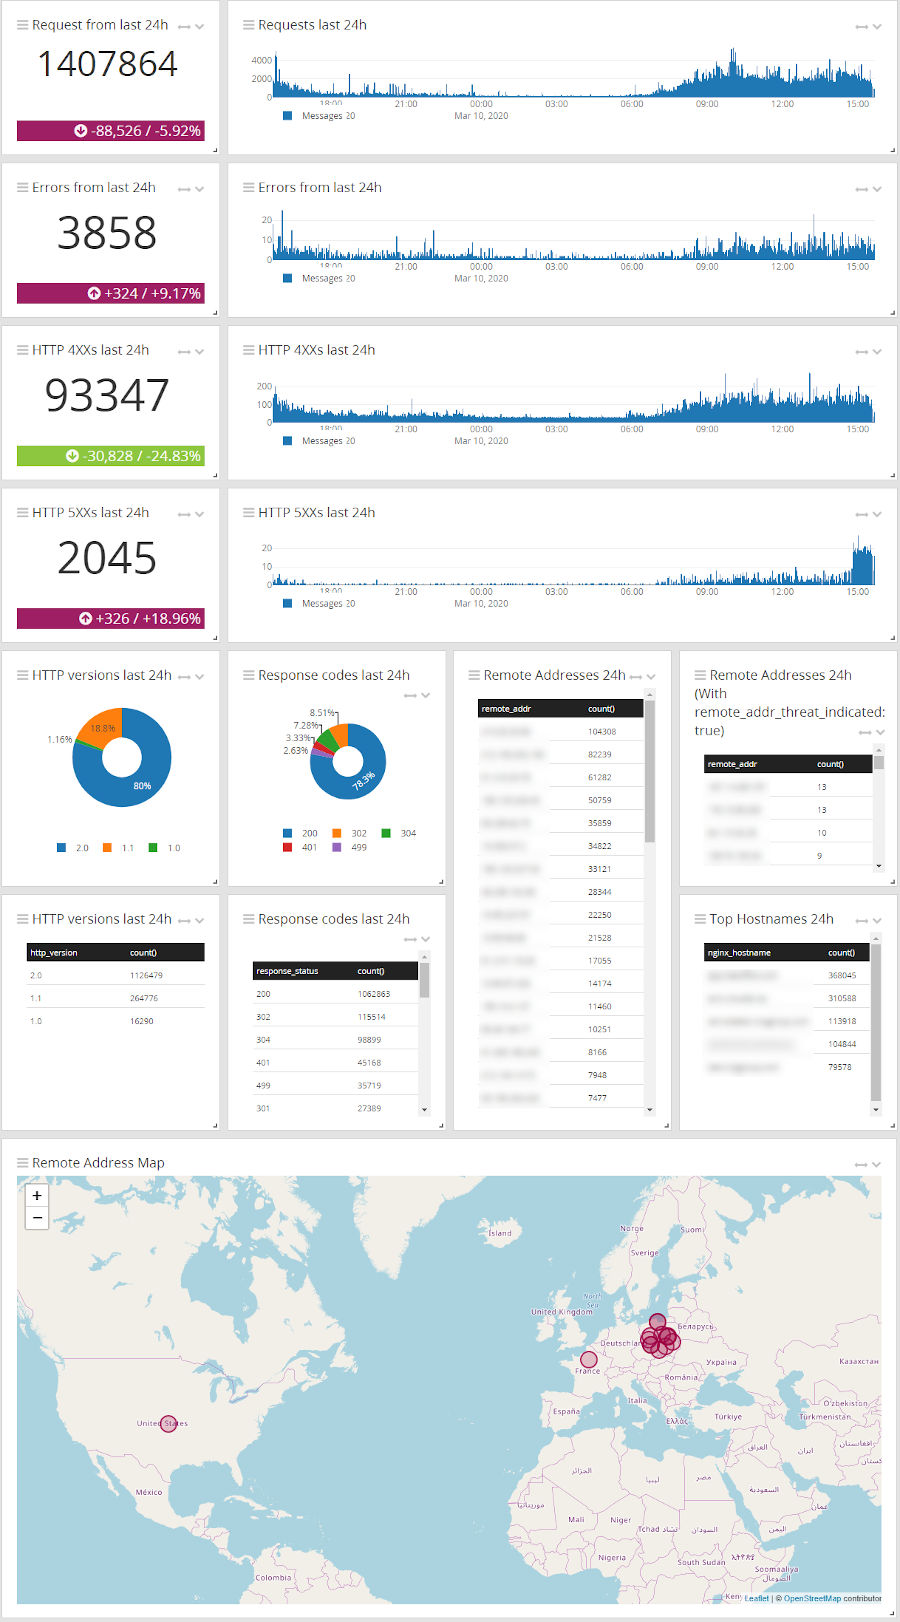
An example of the log dashboard in Graylog
A well-designed dashboard, customized to specific needs, greatly simplifies day-to-day work. Displaying only the most important data on the screen—in the form of easy-to-read charts, diagrams, or alerts—allows you to assess the situation at a glance. For example, a dedicated screen for the HelpDesk team might include data that is relevant to them:
- anyone who has recently been unable to log in,
- Who recently blocked their account on the domain,
- Which group has recently changed its members?
Extracting this information directly from the logs manually would be a daunting and time-consuming task, as it would require searching through millions of logs to find a single relevant record.
It’s also worth noting that by sending logs to Graylog, we create a copy of them in an additional, independent location. We no longer have to worry that someone will delete them from the source system or that we’ll lose them due to a failure.
As mentioned in the introduction, data storage for Graylog is handled by a popular and well-known solution called Elasticsearch. This specialized database offers a wide range of options for accessing data in various configurations through applications integrated with it (via API). One of the most useful of these is Grafana. This open-source tool is widely used by thousands of companies to help monitor IT infrastructure and applications (but not only that—it’s also helpful, for example, in managing industrial infrastructure, tourism, marketing, and many other industries). Grafana allows you to search, visualize, and set up alerts, as well as deeply explore and understand data, no matter where it is stored.
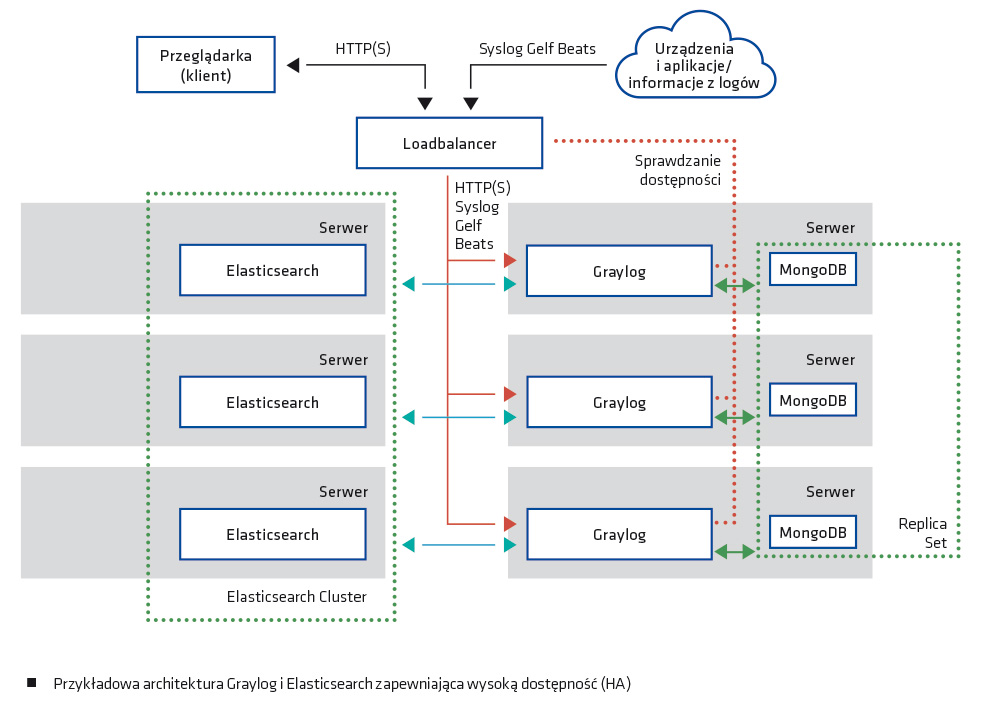
Clusters, data formats, permissions
But let’s get back to Elasticsearch and Graylog. One of the major advantages of these solutions is their ability to be easily clustered. This allows you to distribute the load evenly and ensure high availability of your applications and critical logs by storing them across multiple Elasticsearch nodes. The size of the dataset stored by Elasticsearch is entirely up to us, as we have full control over its retention. There are three criteria for data deletion: size, count, and age. It is therefore possible to delete accumulated data based on your choice of: the size of the dataset (deletes the oldest records once a specified size is exceeded), the number of records, or age (older than).
Graylog has a very extensive and well-documented API. Using it can, for example, provide information on the number of application errors that have occurred in the last 5 minutes, which is then posted to a central monitoring system (e.g., Zabbix). This allows system monitoring to be handled within a single system.
The tool also features a comprehensive alerting system. Alerts can be sent via email, as messages on Teams or Slack, or forwarded to an alert aggregation system such as Alerta. Events can be aggregated from various sources, such as Active Directory and firewalls, to, for example, detect port-scanning attempts on the local network or failed login attempts on our systems.
Graylog supports a wide range of input data formats:
- Syslog (TCP, UDP, AMQP, Kafka),
- GELF (TCP, UDP, AMQP, Kafka, HTTP),
- AWS – AWS Logs, FlowLogs, CloudTrail,
- Beats/Logstash,
- CEF (TCP, UDP, AMQP, Kafka),
- JSON Path from HTTP API,
- NetFlow (UDP),
- Plain/Raw Text (TCP, UDP, AMQP, Kafka).
As for the methods of transferring data from source systems to Graylog, the following are available:
- sending logs via Syslog,
- sending logs in GELF format via the HTTP API,
- Using solutions that collect logs and send them directly to Graylog:
- NXLog,
- Filebeat,
- Audibeat,
- Winlogbeat.
The methods described above allow you to read flat files, import logs from the Windows Event Log, or integrate your own applications with Graylog so that they send logs directly to it.
If Graylog is to serve as a central system for collecting and managing logs, an important aspect of its operation is the authorization system. In this regard as well, the solution offers very extensive capabilities. It can be integrated with AD/LDAP, allowing you to create appropriate roles and assign detailed permissions. Roles can be linked to user groups in AD/LDAP, enabling centralized management of permissions. Permissions themselves can be restricted to a single log view (e.g., only logs from a specific group of systems or only logs related to our AD), dashboard views, or editing capabilities.
Graylog Marketplace
A large community of developers and users has formed around Graylog. Many people publish their own solutions on the official Graylog Marketplace (marketplace.graylog.org), where you can find and download:
- ready-made dashboards,
- pre-built data filters and extractors (splitting messages into fields),
- functionality enhancements (e.g., integrations with Slack/Teams).
Regardless of the size of the organization, the systems in place, or the number of applications in use, we can collect all logs in Graylog. We can collect and visualize them appropriately, thereby helping administrators with their daily work and providing managers with more accessible insights into what is currently happening in their environment. However, it’s important to note that although Graylog has Threat Intelligence capabilities, it is not a fully automated SIEM (Security Information and Event Management) system.
Graylog’s greatest strengths are its extensive integration capabilities with other solutions and its high flexibility. It works perfectly as a tool for storing and aggregating logs.