

Embedded analytics (built-in analytics) is based on a virtual data model embedded in the system S/4HANA. At its core are the so-called CDS (Core Data Services) views, which are structured hierarchically. The most basic of these are views based on specific tables and the combination of data stored in them. At subsequent levels, calculations, filters, and fields are added to create a data view intended for consumption. Analytical queries are embedded within these views; in the 2021 version of the S/4HANA system, over 300 such queries are available. Because the entire model for providing information via CDS views is virtual, no additional data reloading is required, which would otherwise cause delays in reporting.
Ready-to-use analytics applications
Although queries alone would already allow business users to perform flexible data analysis in the Fiori environment, embedded analytics in S/4HANA offers much more. Ready-to-use, predefined applications are available, covering data reporting based on drill-down analysis, KPIs, analytical lists, and overview pages. All of this comes without the need for additional configuration, installation, or effort. To enable business users to take full advantage of the predefined embedded analytics content, all that is required is to grant the appropriate permissions. The table below summarizes the types of predefined reporting applications available within embedded analytics.
List of Embedded Analytics Reporting Applications
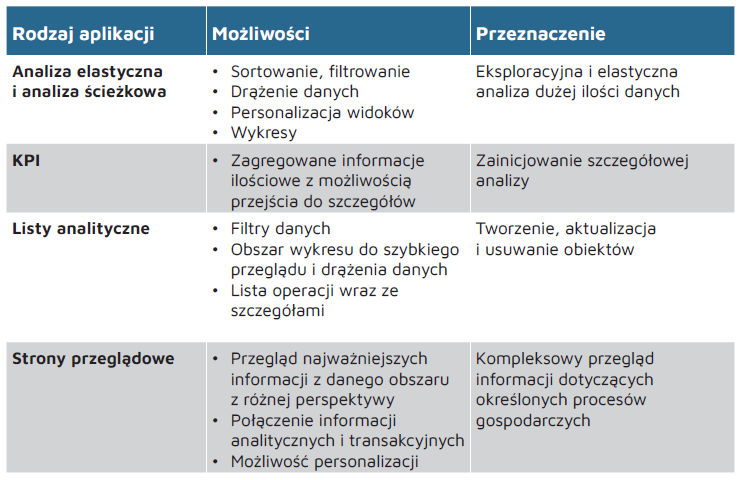
The range of capabilities offered by individual reporting applications within embedded analytics—and their uses—is broad. However, they share certain common features. Most of them allow users to drill down to more detailed views or perform relevant transactional operations. They also allow users to export data to local files in both spreadsheet and PDF formats.
From Quote to Invoice
Most of the predefined analytical queries—and, consequently, the applications based on them—relate to financial, sales, and inventory data. Other modules are also included, though to a lesser extent at this time. Later in this article, we present selected embedded analytics applications for data from the SD module.
The Fiori applications available as part of embedded analytics enable data reporting at every stage of the sales process. The S/4HANA system provides ready-to-use tools for viewing information about quotes, sales orders, deliveries, and invoicing documents across various dimensions. Here are just a few examples.
Incoming Customer Orders – Flexible Analysis
The application allows you to view incoming sales orders on a monthly basis, both by value and by quantity. Among the ways this report can be used are:
- displaying data on the value and quantity of orders in a chart or table, including identifying monthly sales trends,
- drilling down into the data to view detailed information on selected organizational units, products, product groups, customers, sales document types, etc.,
- filtering data according to selected criteria,
- changing the display properties of individual components, e.g., specifying how a product is displayed (material index or text), summaries, etc.,
- saving a customized view.
Delivery Efficiency – KPIs and Analytical Report
The application allows you to monitor the current efficiency of sales order deliveries. This is done by comparing the delivery date requested by the customer for a sales order item with the actual delivery date of the corresponding outbound shipments. If the metrics are unsatisfactory, the application allows you to navigate to the relevant sales document pages and master data objects to obtain detailed information. While working with the application, you can, among other things:
- using both text (compact) and visual filters,
- viewing data by specific dimensions, including: delivery status, required delivery date, scheduled release date, client, product, and others,
- displaying delivery delays in days.
The Fiori tile (KPI) itself, which allows users to navigate to the application, displays a graphical representation of the percentage of sales orders delivered on time over the past three weeks.
Revenue – KPIs and Path Analysis
By creating analysis paths, the application allows you to view sales figures across various dimensions, including in particular:
- time period (year, quarter, month),
- organizational unit,
- distribution channel,
- customer and customer group,
- product and product group.
It is possible to filter data at each stage of the analysis, which provides detailed insights at the final stage of the process.
Sales Management Overview – Overview Page
This application provides a comprehensive overview of the current sales situation, allowing you to respond promptly. Each aspect of the sales process is represented by a separate tab. The tabs display relevant KPIs presented visually. The results can be filtered by various criteria, such as client, sales department, distribution channel, and others. Each tab allows you to access detailed data. The app’s tabs include information on:
- incoming sales orders,
- customer returns,
- incomplete sales documents,
- margins,
- blocked and overdue sales orders.
Embedded Analytics for Sales in SAP S/4HANA
-

- Selected embedded analytics applications for sales data
-

- Incoming Customer Orders – Flexible Analysis
-

- Delivery Efficiency – KPIs and Analytical Report
-

- Revenue – KPIs and Funnel Analysis
-

- Sales Management Overview – Overview Page
And what if that’s not enough?
Embedded analytics enables the analysis of data related to specific business processes from various perspectives. The information is presented across different cross-sections and dimensions, using both tabular and visual formats. It is precisely the reports within this functionality that should be considered first when implementing S/4HANA. For the most part, analytical queries can also be viewed in both SAP Analysis for Excel and SAP Analytics Cloud.
However, in the case of specific business processes, requirements, or certain modules, it may be necessary to supplement the built-in analytics. Starting with the least time-consuming and cost-intensive solutions that supplement the predefined reports provided as part of embedded analytics, these include:
- defining custom reports and KPIs based on existing analytical queries,
- modifying existing analytical queries and creating custom ones based on predefined CDS insights,
- modifying existing CDS views or creating new ones,
- using the built-in SAP BW data warehouse component for the S/4HANA system, e.g., to load planning data from a file.
It should be noted here that, despite its wide range of capabilities, SAP S/4HANA embedded analytics does not replace a data warehouse (e.g., SAP BW/4HANA). The purpose of analytics embedded in the transactional system is to support operational decisions based on current data. For strategic or tactical decisions that depend on both current and historical data, a data warehouse should still be used.
It is BW/4HANA-type systems that enable the integration, harmonization, and consolidation of data from various source systems. They include the necessary tools for data planning, forecasting, and transformation. In the case of BW/4HANA, CDS insights generated by the user or predefined in the S/4HANA system can serve as data sources. Therefore, the two reporting environments (embedded analytics and BW/4HANA) should not be viewed as substitutes for one another, but rather as complementary tools.
Data—From the Big Picture to the Details
The volume of information to be processed, a rapidly changing reality, and the need for immediate responses require business users to make decisions based on up-to-date data. This data should be presented in a clear, easy-to-read format, both in tabular and graphical forms. Users should be able to drill down into the data, moving from aggregated information to detailed data on individual documents, and even edit them. The interface should be as intuitive as possible. Embedded analytics in S/4HANA meets all of these requirements .